Our Cities, Our Future: Cities are at a crossroads.
Cities face a multitude of challenges, yet within this complexity lies the potential for remarkable transformation. The Future of Cities: A Data-Driven Approach toTackling Grand Challenges and Building Sustainable, Resilient Communities explores how place leaders — mayors, urban visionaries, and catalysts — armed with data-driven decision-making and citizen-science, can tackle grand challenges such as sustainability, health, education, security, and poverty.
By examining real-world examples and data analysis, the book reveals how data-driven leadership equips cities to implement effective solutions that serve local communities. The book empowers leaders with actionable steps to build a more sustainable, equitable, and thriving future for all by leveraging the collective intelligence and collaborative spirit that citizen science ignites.
My passion for leadership led me to write this book, drawing on my research to showcase the power of public leadership in driving positive urban transformation. My passion for the arts led her to personally paint the cover artwork, reflecting my commitment to the intersection of creation, creativity and urban development.
Embrace the Potential. Transform Your City.
Thank you for having purchased the book and joining us on this journey toward a better future for our cities. I hope the book provides you with valuable insights and tools to create positive change. Let’s create something extraordinary together. Contact me to explore possibilities.
This webpage aims to provide high-resolution versions of the figures presented in the book, allowing for a detailed examination of the data and insights. While the figures offer valuable visual representations, they do not constitute a comprehensive summary of the book’s content, which includes in-depth analysis, case studies, actionable recommendations and much more.
All rights reserved. No part of this text may be reproduced, transmitted, downloaded, reverse-engineered, or stored in or introduced into any information storage and retrieval system, in any form or by any means, electronic, mechanical, photocopying, recording, now known or yet to be developed, without the prior permission of the author.
The depiction of boundaries and territories of maps in the book are for visual, representational and explanatory purposes only and may be incomplete and they do not constitute endorsement or expression of any political position.
Introduction:
Reimagining Cities with Evidence-Based Strategies
Cities are the engines of our economies of human connection. Yet, urban leaders face a multitude of challenges, from economic disparity to environmental threats. But within these complexities lies an immense potential for positive change. This book discovers the power of data-driven leadership to unlock that potential. We’ll explore the stories of visionary mayors who dared to dream big and implemented innovative solutions. From Barcelona’s pioneering sustainability initiatives to Amsterdam’s inclusive social policies, each chapter illuminates a unique urban idea centred around a grand challenge.
These leaders prove that effective leadership isn’t about titles; it’s about harnessing the power of innovation to tackle complex problems and empower communities. So, if you’re ready to be inspired by the stories of urban transformation, backed by data-driven insights, and discover the untapped potential within our cities, join me on this journey.
Building upon the idea that political will is a renewable resource, exploring place leadership seamlessly transitions to addressing grand challenges. Grand challenges are shared societal and environmental concerns that require a joint vision guiding multi-actor processes, which serves as a basis for structural change. My book examines mayors determined to address grand challenges and have a robust urban agenda addressing sustainability, equality, and justice. They stand as place leaders, given their ability to influence wider networks to initiate and implement novel ideas.
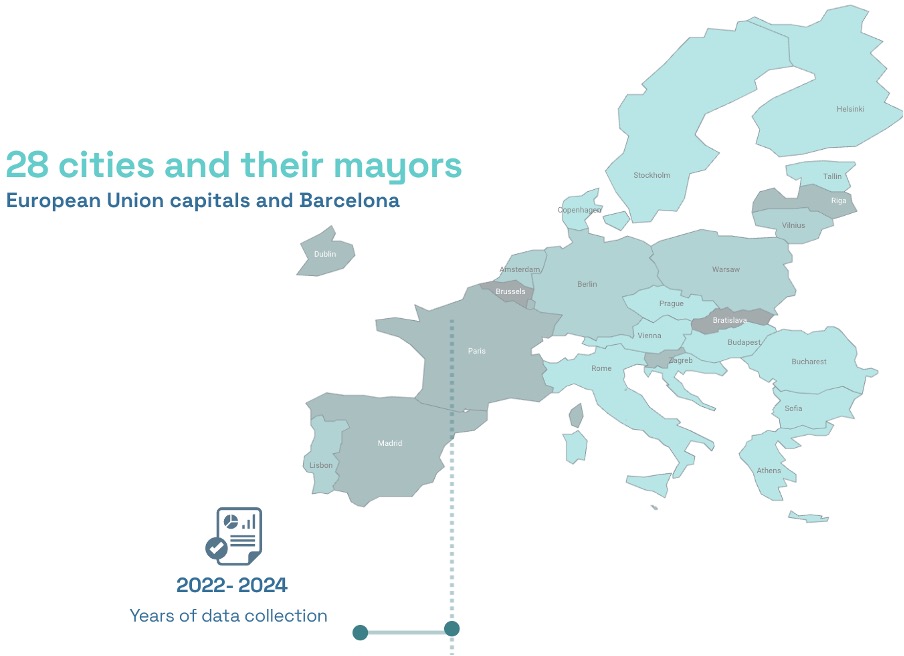
The book concentrates on the 27 capitals of the European Union and Barcelona, representing a collective population of over 43 million. The following graph offers a concise overview of the cities and their respective mayors featured in the book (at the time of data collection).
Chapter 1:
Rethinking Urban Responses to Global Challenges
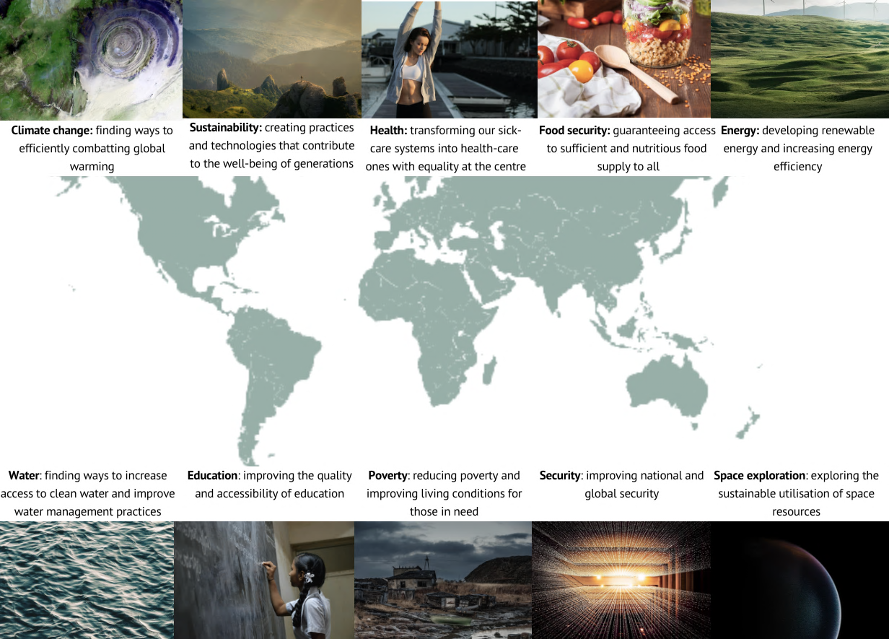
Grand challenges represent complex and interdisciplinary problems that reach across borders, necessitating the involvement of multiple scientific and technical disciplines. Furthermore, they require the collaborative efforts of a diverse and wide range of stakeholders and communities due to their wide-ranging and often severe, long-standing, and unequal implications for society.
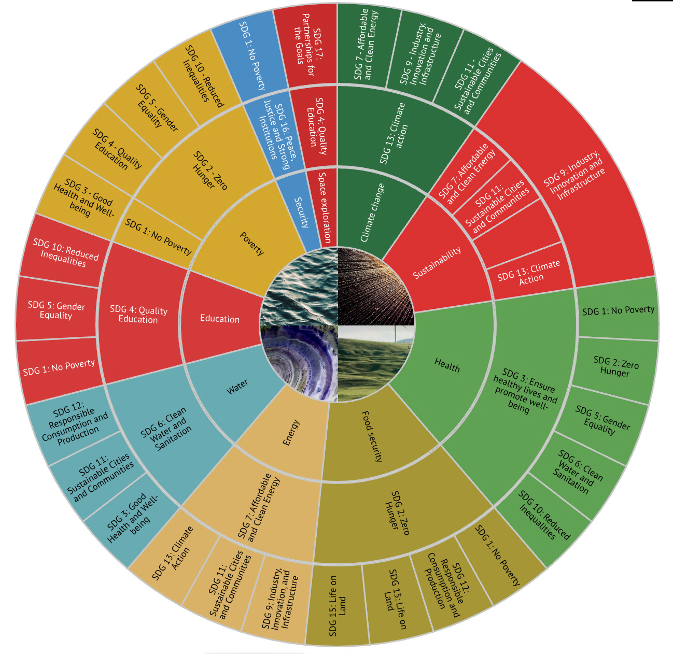
Most of the grand challenges are addressed by the SDGs, as addressing grand challenges is critical for achieving SDGs. For example, climate change is primarily addressed by the Sustainable Development Goal 13 (SDG 13) on Climate Action, which calls for urgent action to combat climate change and its impacts. While, other SDGs, including SDG 7 on Affordable and Clean Energy, SDG 9 on Industry, Innovation and Infrastructure and SDG 11 on Sustainable Cities and Communities, also define targets linked to climate change. The following graph provides an overview of which SDGs are addressing the abovementioned examples of grand challenges (non-exhaustive list):
Chapter 2
From Mayors to Networks
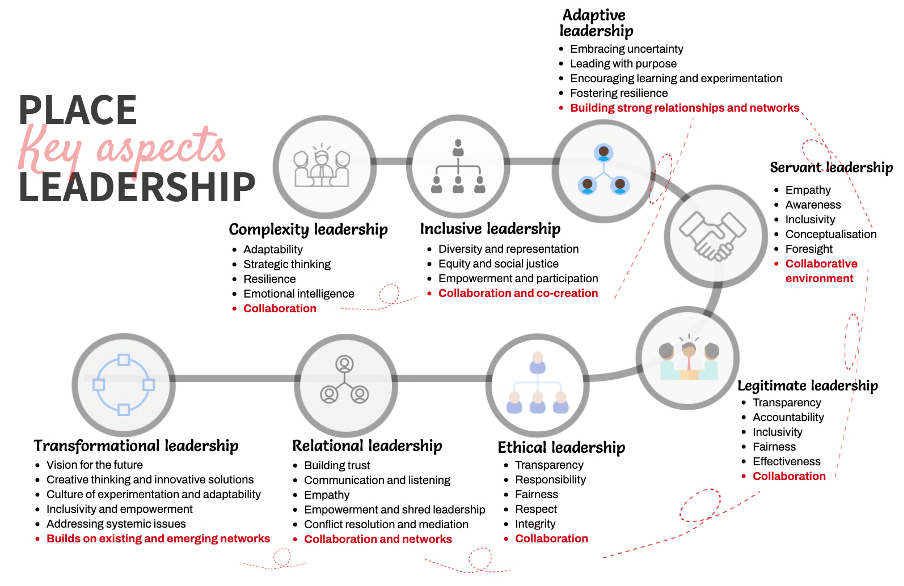
Place leadership is the process of leading the development and management of a specific place, including cities. Place leadership brings together diverse stakeholders, including local governments, business, communities and community organizations, residents, educational institutions, environmental organizations to work toward a shared vision for the place; a vision that is collectively owned and strived for and that addresses common challenges of various communities of the city.
The graph provides an overview of different leadership approaches, emphasising the element linked to networks. Collaboration, co-creation, the establishment of robust relationships, the cultivation of a collaborative environment, and the orchestration of networks collectively highlight the imperative for interconnectedness and shared endeavours in the realm of urban leadership.
Chapter 3
Reshaping Governance for a Dynamic Urban Future
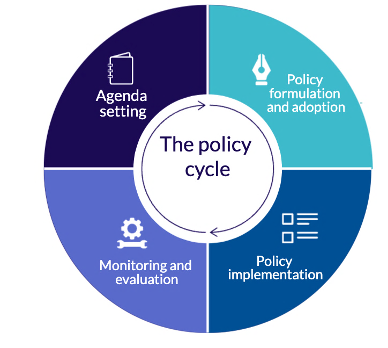
Effective urban governance requires a comprehensive understanding of the policy cycle, which guides public policy development, implementation, and evaluation. The policy cycle is a continuous process of identifying, prioritising, formulating, adopting, implementing, and evaluating policy issues.
Chapter 4
Exploring the European
Urban Landscape
In the dynamic territories of the European Union’s major cities, urban leadership is a thread that connects the past, present, and future. These cities, as hubs of innovation, culture, and commerce, require visionary leaders who can navigate the complexities of urban life, address the challenges of a rapidly changing world, and champion the aspirations of their citizens.
As the EU capitals navigate the complexities of the 21st century, urban leadership will be more critical than ever. The ability to foster innovation, promote social cohesion, and champion sustainable development will ensure these cities remain vibrant, resilient, and prosperous hubs of human endeavour.
The European Union’s capital cities symbolise aspirations for peace, prosperity, and unity. They are the crossroads of cultures, the engines of innovation, and the embodiment of the EU’s commitment to a better future for its citizens.
Chapter 5
A Landscape of Urban Priorities
The complexities of urban life, coupled with the urgency of addressing pressing issues, often lead to diverging approaches and unexpected challenges regarding political priorities. In the face of these complexities, mayors must juggle numerous priorities, navigating the delicate balance between social progress, economic growth, social cohesion, and environmental protection. They must contend with the ever-changing demands of their constituents, the pressures of political agendas, and the constraints of limited resources.
Despite these challenges, mayors continue to strive toward their vision for a better city, their unwavering commitment to their communities, inspiring innovation and resilience. Though often tested and refined, their political priorities remain the compass guiding their leadership, shaping each European city’s unique character and trajectory.
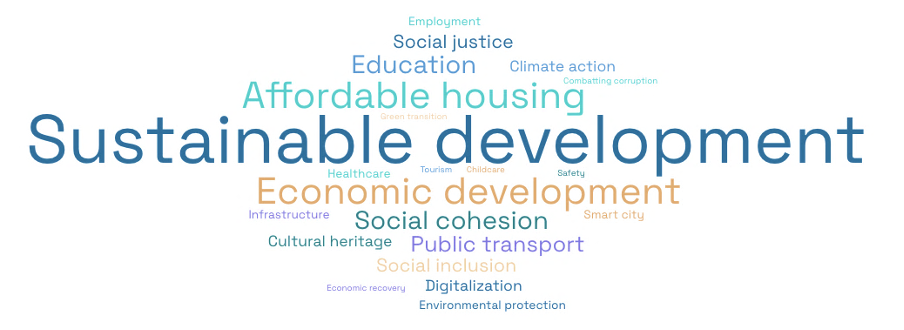
The world cloud comprises the top three political priorities of the 28 cities analysed. While more than 60% of the mayors define sustainable development as one of their top political priorities, only one mayor in this analysis considers combatting corruption or improving public safety as a priority. After sustainable development, the second most popular priorities are affordable housing and economic development (more than 30% of the cases defined as a priority), followed by education and social cohesion (more than 20%). However, the relatively low priority given to combating corruption and improving public safety raises questions about these cities’ challenges in upholding good governance and ensuring their citizens’ safety.
Chapter 6
Data-Driven Urban Insights
The complexities of urban life, coupled with the urgency of addressing pressing issues, often lead to diverging approaches and unexpected challenges regarding political priorities. In the face of these complexities, mayors must juggle numerous priorities, navigating the delicate balance between social progress, economic growth, social cohesion, and environmental protection. They must contend with the ever-changing demands of their constituents, the pressures of political agendas, and the constraints of limited resources.
What is needed to address ongoing or possible future challenges that urban communities are facing is convening a diverse group of representatives — residents, community leaders, scientists, government officials, and the mayors themselves. Through facilitated discussions and workshops, this collective wisdom tackles the critical question: What are the most pressing issues impacting our society today? This collaborative process ensures the questions we analyse resonate with the real challenges people face, moving us beyond generic studies to targeted investigations tackling the heart of the matter.
The chart represents the basic steps that allow place leaders to assess local needs, which would then allow the appropriate policy response to the challenge or opportunity.
Citizen science empowers communities with knowledge and a voice, fostering a sense of ownership in solutions. It encourages transparency and accountability in policy implementation and monitoring, ensuring decisions are made with the best available data and the active involvement of the people they impact. Citizen science is a powerful tool for collective problem-solving, leading to a more informed and engaged citizenry working hand-in-hand with policymakers to create a better future.
Chapter 7
Achieving Sustainable
Urban Futures
Cities are at the forefront of the sustainability movement as the world grapples with the consequences of climate change and resource scarcity. Place leadership has been pivotal in driving innovative and effective measures to promote sustainable urban development. From pioneering renewable energy projects to implementing energy-efficient infrastructure and promoting sustainable transportation options, cities have demonstrated that sustainability is not just a distant aspiration but a tangible reality within their grasp.
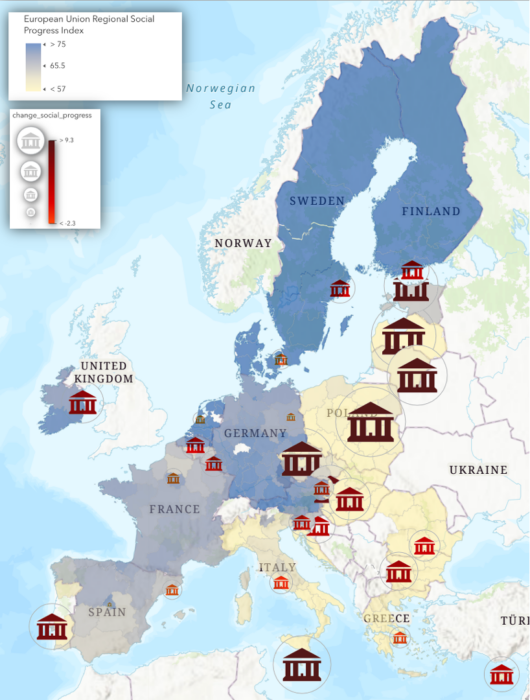
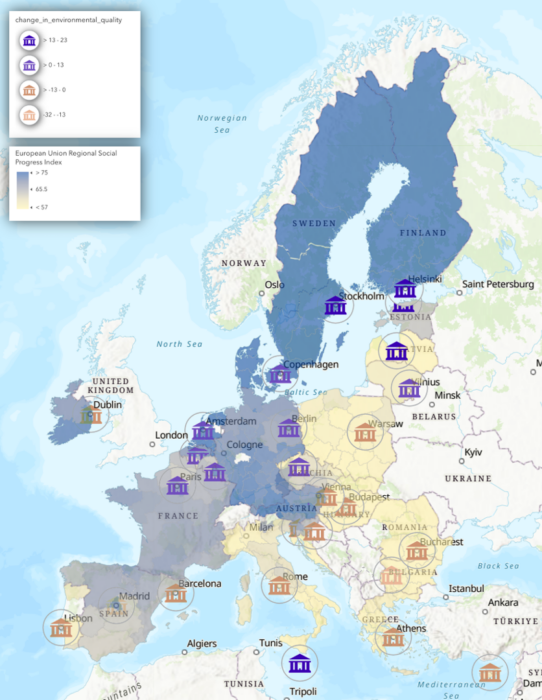
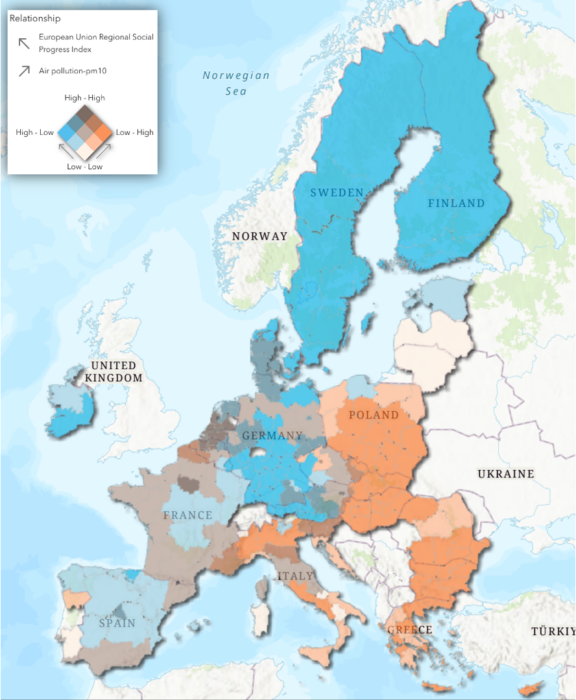
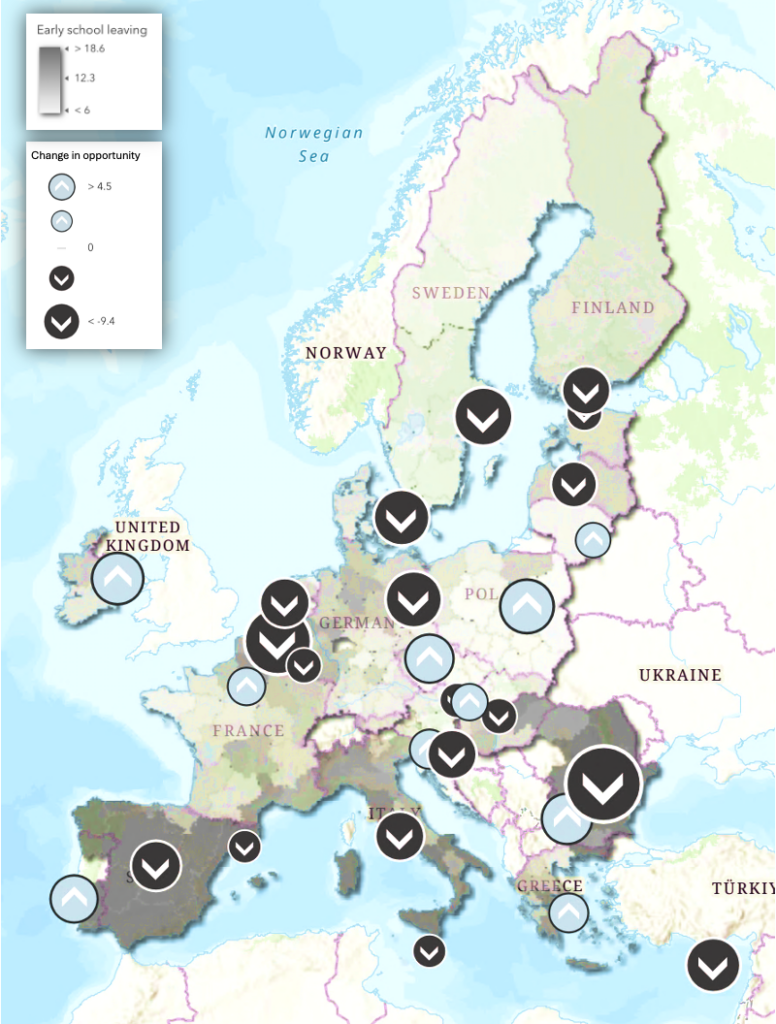
The mapshows the change in regional social progress in the European Union within a four-year period. The base map shows the EU regional social progress data from base year, while the town hall icons indicate the change in regional social progress from the base data.
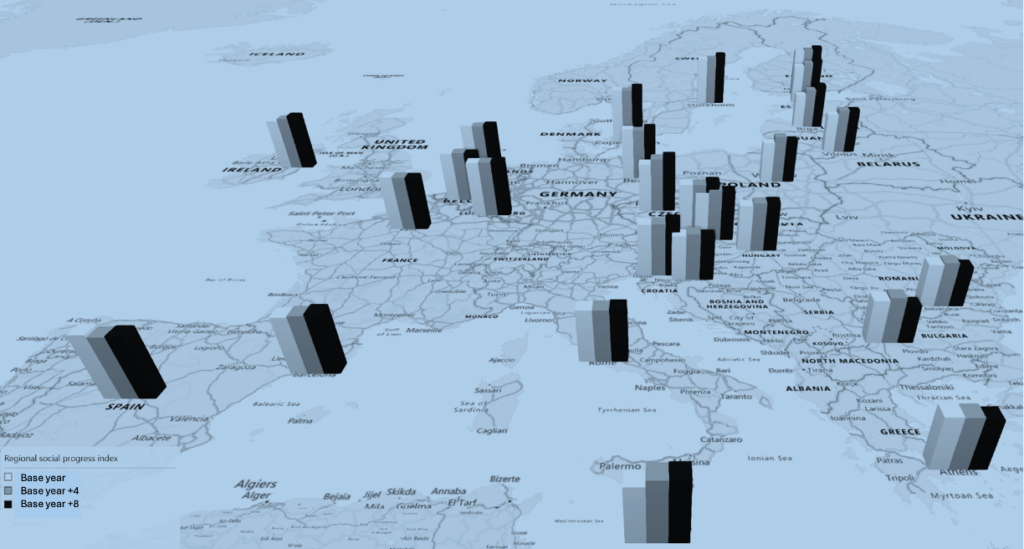
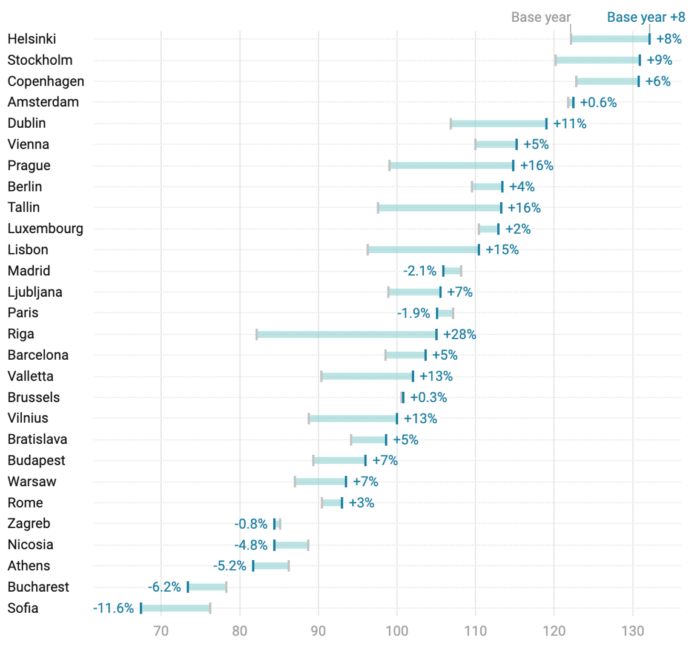
The subsequent map and graph visualize the evolution of social progress from the first edition of the Regional Social Progress Index to the time of writing this book. This temporal perspective is essential for understanding the pace and direction of social change, enabling the identification of both thriving and lagging regions. Such insights are crucial for policymakers, researchers, and practitioners seeking to inform evidence-based interventions and foster equitable development across Europe.
Chapter 8
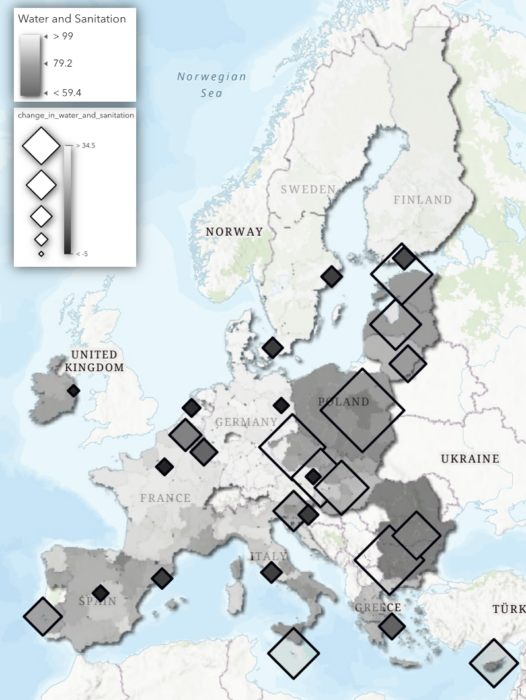
Equitable Access to Water and Sanitation
This water and sanitation map on the left utilizes shading to depict baseline water and sanitation scores across territories.
By analyzing this relationship, we can potentially identify regions where improvements (larger, lighter squares) or declines (smaller, darker squares) have been most significant, even if their baseline score (indicated by shading) remains low. This allows us to pinpoint areas where interventions have had a substantial impact, or conversely, where water and sanitation access may be deteriorating.
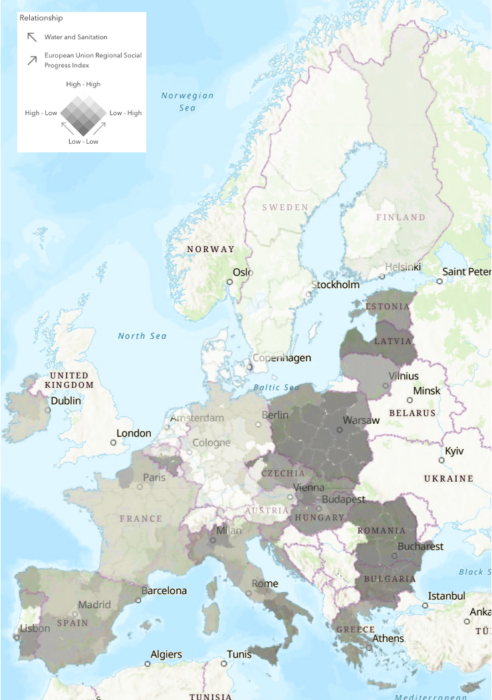
While, the map below shows a general correlation between social progress and water and sanitation scores.
Chapter 9
Enhancing Urban
Environmental Quality
The quality of the environment directly impacts the health and well-being of city dwellers. Place leadership has emerged as a driving force behind initiatives to improve air quality, reduce pollution, and enhance urban green spaces. By investing in green infrastructure, promoting sustainable urban planning, and enforcing environmental regulations, cities have demonstrated their commitment to creating a healthier and more livable environment for all.
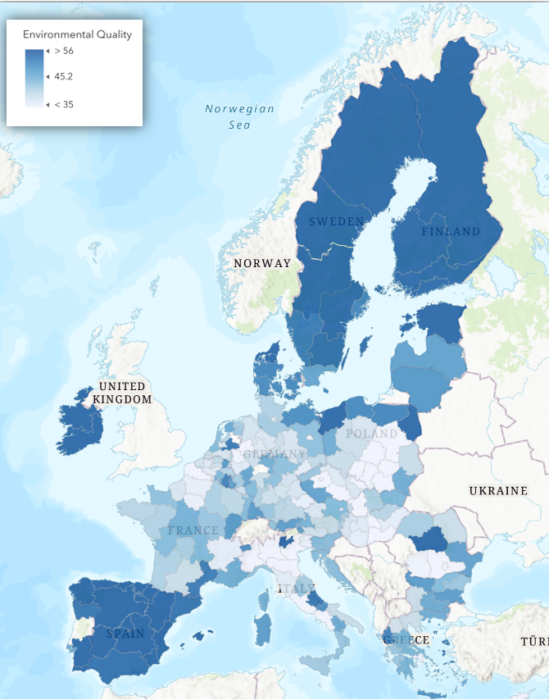
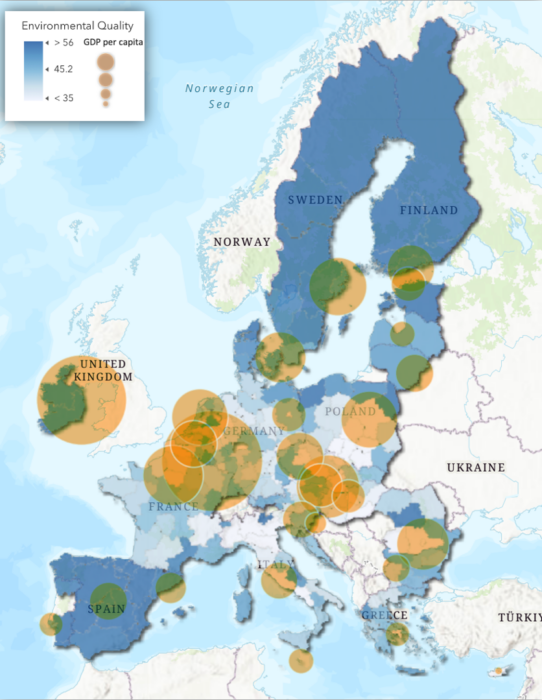
The map on the right shows the environmental quality of European regions, suggesting a strong correlation between environmental quality and economic development.
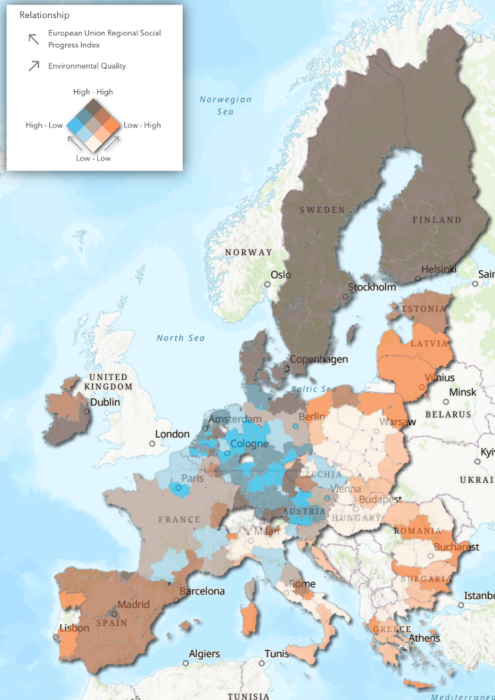
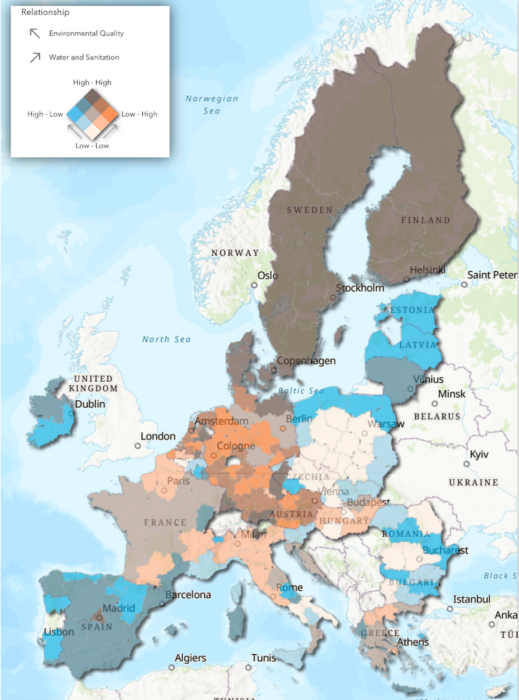
While the map below shows the relationship between social progress and environmental quality in European regions.
The map on the right highlights the correlation between environmental quality and water and sanitation.
Overall, we can observe that geographies with high environmental quality and social progress ratios tend to have high environmental quality changes (the map on the right).
Looking at GDP per capita and environmental quality indexes, there is a positive correlation between environmental quality and GDP per capita in the analysed cities, with a coefficient of 0.38 (map below).
Looking at GDP per capita and environmental quality indexes, there is a positive correlation between environmental quality and GDP per capita in the analysed cities, with a coefficient of 0.38. This means regions with higher GDP per capita generally have higher environmental quality scores. The map highlights significant regional variations in this relationship.
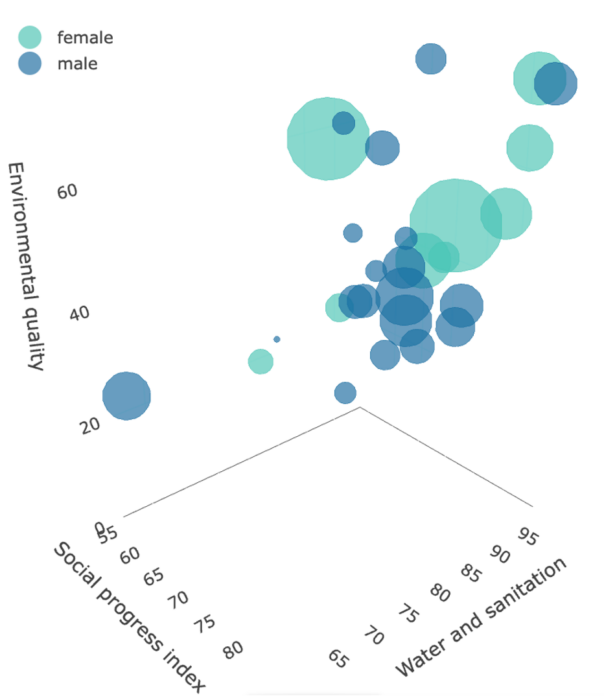
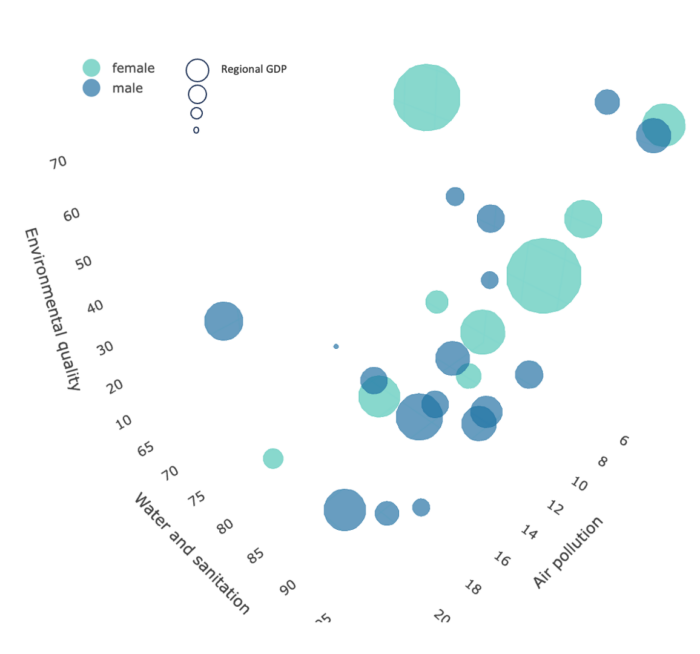
While, the 3D graph highlights the correlation between regional social progress, environmental quality and water and sanitation. Furthermore, the shades of the circles show the gender of the mayor (darker shade for male mayor and lighter shade for female), while the size of the circle is the regional GDP. To fully enjoy the graph, use this link to the whole interactive graph: https://rpubs.com/fatimebarbara/1133560
The map provides a snapshot of the potential relationship between social progress and air pollution across European territories. While more research is needed to understand the underlying causes and complexities fully, some trends may suggest that investing in social progress can contribute to cleaner air and healthier communities. The map shows a negative correlation between social progress and air pollution. Regions with higher social progress scores tend to have lower air pollution levels. Conversely, regions with lower social progress scores generally have higher air pollution levels.
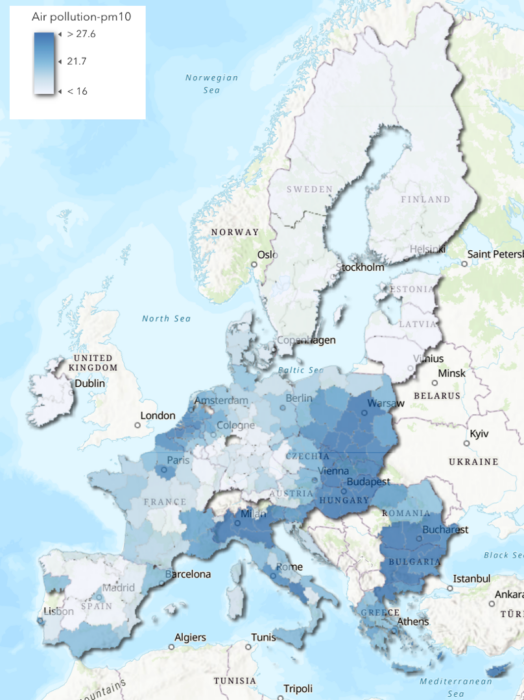
The map below shows that air pollution levels, in this case measured by PM10 concentration, vary significantly across European regions. Many regions on the map exceed this limit, highlighting residents’ potential health risks.
The 3D graph allows a richer understanding of the relationships between environmental quality, water and sanitation, air pollution, and factors like urban GDP and the major’s gender. There are cities with high urban GDP across all quadrants of the graph. To enjoy the graph’s 3D component, please visit: https://rpubs.com/fatimebarbara/1133830
Chapter 10:
The Power of Public Transport
Within the dynamic ecosystem of urban environments, public transport emerges as a potent force for positive transformation. Its influence transits beyond mere mobility, permeating the very fabric of sustainability and social progress.
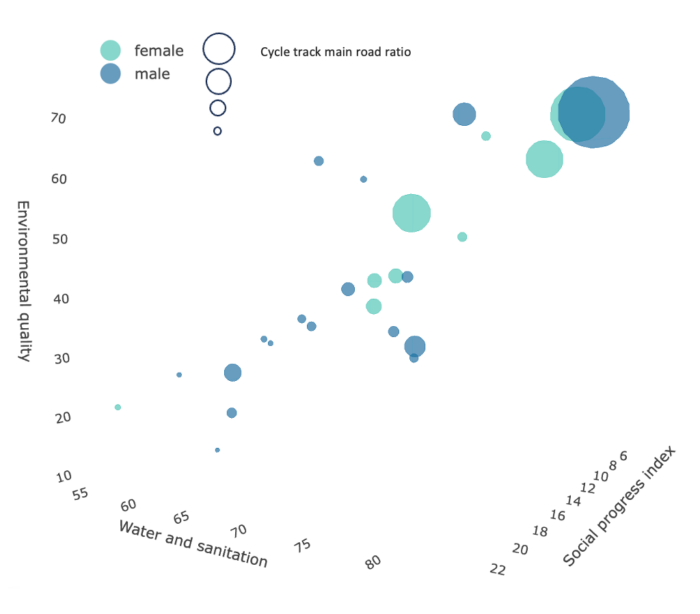
The following 3D graph represents how the indicators linked to cycling infrastructure correlate with some of the other measures. The bigger the circle is, the higher the cycle track ratio to the main road in a given city, while lighter shades indicate female mayor in the city, darker shade male mayor. The cycle track ratio to main roads refers to a metric used to measure the length of cycling infrastructure relative to the overall length of roads in a particular area.
The interactive nature of the graph allows for further exploration by providing deeper insights into the variations and nuances within the overall trends; here’s a link: https://rpubs.com/fatimebarbara/1134138.
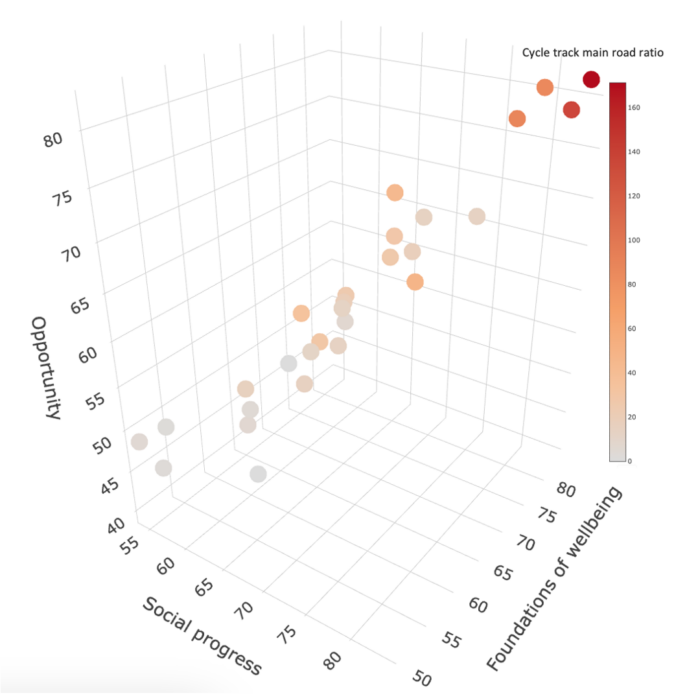
How Cycling May Enhance Social Progress
This shows the relationship between opportunity, social progress, well-being foundations, which all represent different dimensions of the European Social Progress Index and the city’s cycle track ratio. The opportunity dimension of the European Regional Social Progress measures the extent to which people have the opportunity to achieve their full potential and live a fulfilling life. It includes indicators such as access to education, employment, and healthcare. As presented previously, the social progress dimension of the index measures the level of well-being in a society, including factors such as security, access to necessities, and environmental quality. It includes life expectancy, clean water and sanitation access, and greenhouse gas emissions. The foundations of the wellbeing dimension of the index measure the underlying factors that contribute to social progress and well-being, such as personal autonomy, social cohesion, and resilience. It includes indicators such as trust in others, civic participation, and corruption.
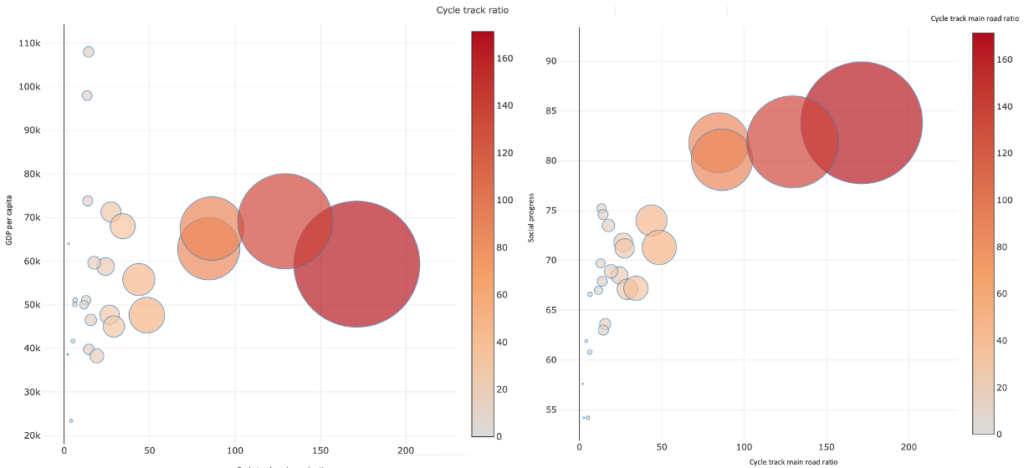
Looking at the cycle track ratio and GDP data, a positive correlation exists between the proportion of cycle tracks in a city and its GDP per capita.
It is also interesting to note that the relationship between cycle tracks and GDP per capita is not linear. Many cities with low GDP per capita have a relatively high proportion of cycle tracks. This suggests that other factors can influence a city’s decision to invest in cycle infrastructure, such as its population density or air quality. The figure on the left shows the correlation between GDP per capita and cycle track ratio: the more intense coloured and bigger the circles are, the higher the cycle track ratio to main roads is. While the relationship between social progress and cycling infrastructure reveals an even more clear positive correlation between a city’s cycling track ratio and social progress index score.
Chapter 11:
The Progress of Sustainable Cities
Sustainability in the context of cities refers to the ability of urban areas to meet the needs of their residents without compromising the ability of future generations to meet their own needs. Sustainable cities are essential for the future of humanity. Cities need to find ways to become more efficient and less wasteful.
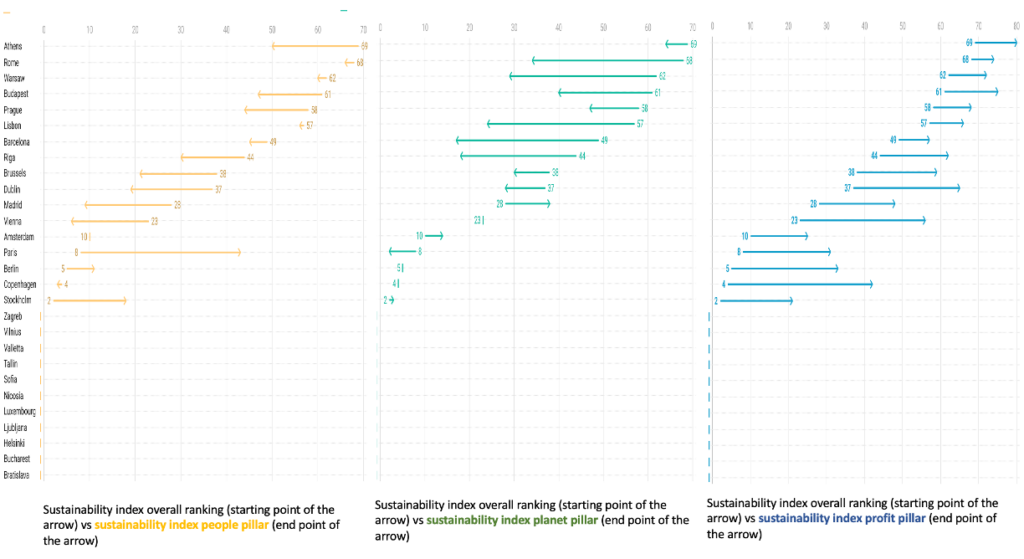
The Arcadis Sustainable Cities Index provide a comprehensive view of urban sustainability, highlighting that solid performance in one area doesn’t negate weaknesses in others. The graphs demonstrate how some cities score much higher or lower in specific pillars than their overall score. Most cities score lower in the people and planet pillars than the overall score, while they score higher on the profit score. (Source: https://www.arcadis.com
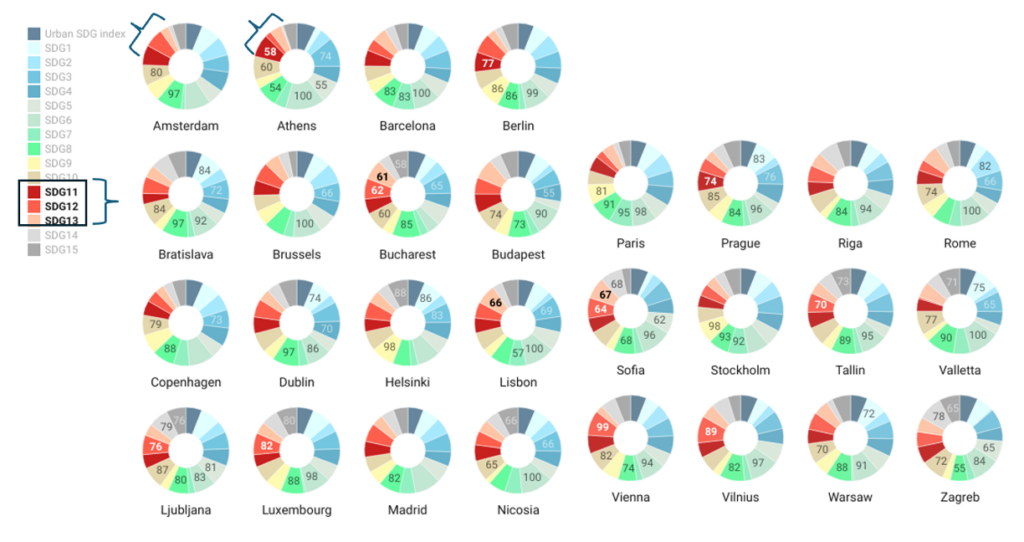
This figure highlights how high the cities score as regards to SDGs 11, 12 and 13 (indicated with the three red shades). The figure also allows us to see if the cities score higher or highest in these three SDGs compared to other ones (the highest-scoring goals include the scores).
(Source: Sustainable Development Solutions Network)
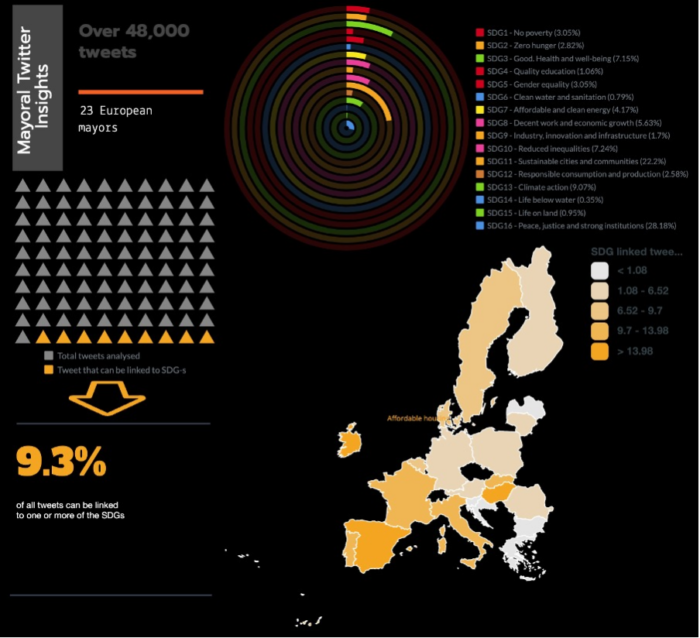
Over 48000 tweets of the mayors have been analysed. Using the SDG controlled vocabulary, out of the over 48000 tweets analysed, 9.3% can be linked to one or more of the SDG-s, meaning that mayor’s communication and efforts behind are focusing on a topic that can be linked to one of the SDG-s. looking at the same data at individual SDG levels, over 28% of the tweets that can be linked to any SDG, can be linked to SDG16 on peace, justice and strong institutions, while over 22% to sustainable cities and communities. Other remarkable figures are that over 9% of SDG-linked tweets are about climate action, over 7% of reduced inequalities and again over 7% of good health and well-being.
Chapter 12:
Cities and Health
Pursuing sustainable cities extends beyond simply reducing carbon footprints and conserving resources. It’s about building vibrant communities where human health thrives alongside a healthy planet. As we pave the way for efficient energy use, clean air, and thriving ecosystems, we pave the way for more nutritious lives. This isn’t a serendipitous outcome but a deliberate one — a conscious weaving of urban design and well-being.
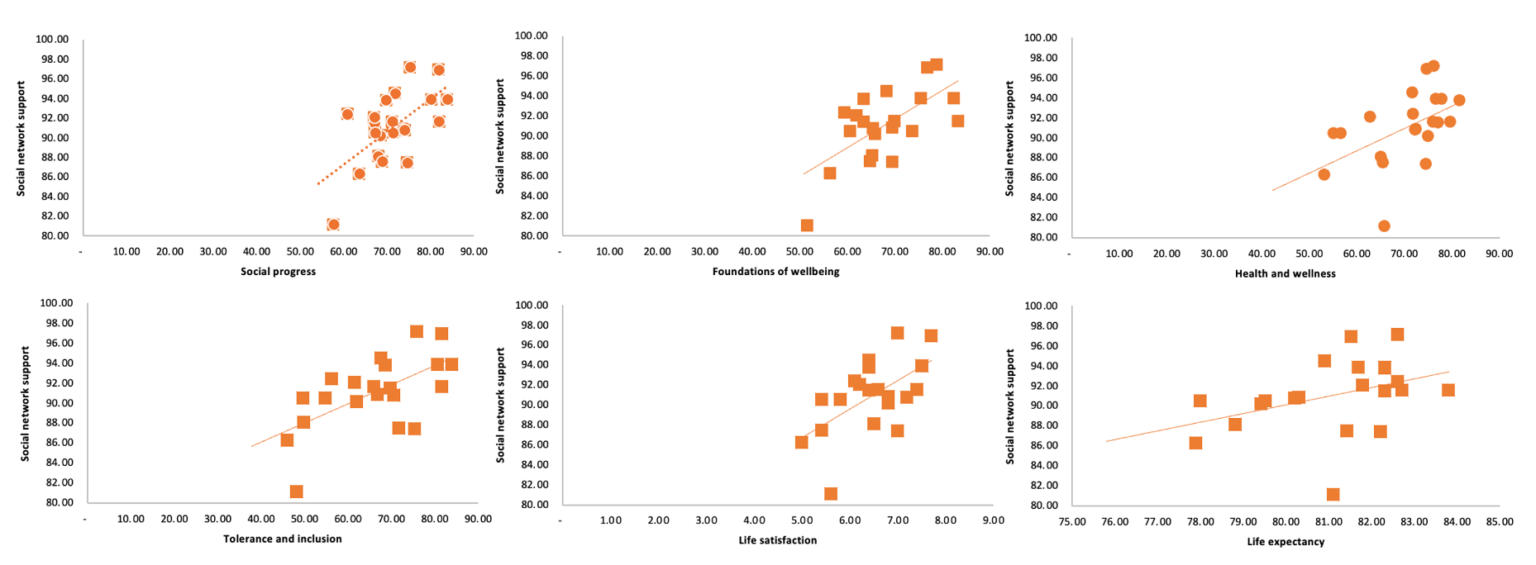
The following graphs depict the correlation between social network support and other indicators linked to well-being such as the social progress index, tolerance and inclusion, foundations of well-being, life satisfaction, health and wellness, and life expectancy. Most of these indexes are complex indicators, such as the tolerance and inclusion that includes measures such as institutional impartiality, tolerance toward immigrants, minorities, volunteering or gender employment gap.
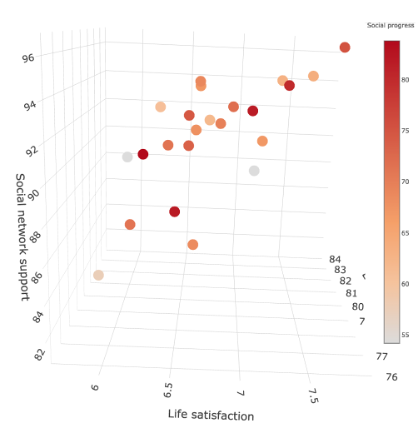
Observing the same data on the following 3D graph, social network support shows a positive correlation with life expectancy (correlation coefficient 0.39) and a strong positive correlation with life satisfaction (correlation coefficient 0.68) and with social progress (correlation coefficient 0.69).
To discover the graph in more details, visit: https://rpubs.com/fatimebarbara/1150750.
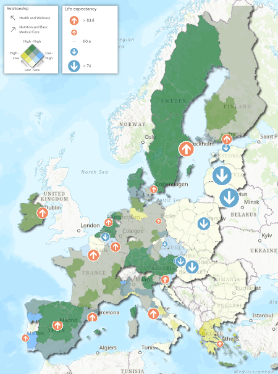
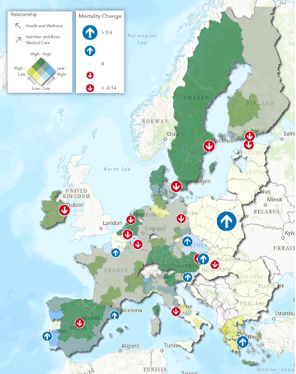
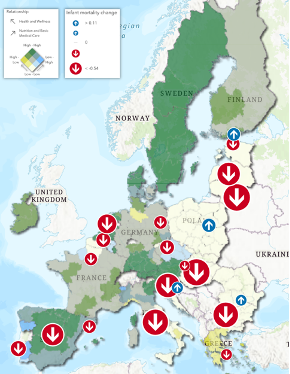
These maps illustrate some exciting ways in which maps can highlight geographical disparities in health results, depicting Social Progress data linked to health and wellness, and its ratio to nutrition and primary medical care data. Light grey shading indicates regions with high scores on health and wellness and access to nutrition and primary medical care. These areas boast vital access to preventive measures, quality healthcare, and healthy living conditions. The darker colours represent areas with lower scores on either or both aspects. This could point to limited access to healthcare, nutritional deficiencies, or poorer living conditions impacting overall health.
The arrows indicate above and below averages for (in order) life expectancy, mortality rate change, and infant mortality rate change for the same time periods.
Previous
Next
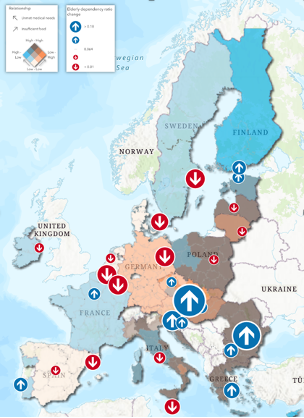
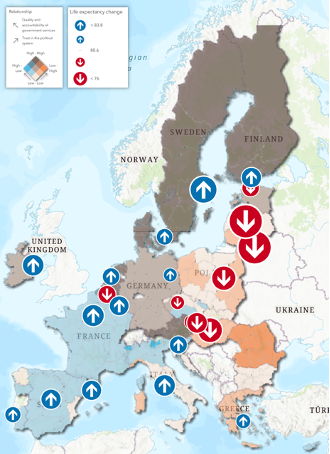
Hence, these two other maps illustrate the relationship between unmet medical needs, insufficient food supply, and elderly dependency ratio, as well as life expectancy.
Chapter 13:
Closing the Equity Gap: Education
Education transcends the confines of textbooks and classrooms, weaving its threads into the very fabric of our communities. It shapes how we view ourselves, interact with the world, and navigate the complex challenges of our time. Individually, education empowers us to make informed decisions about our health, sustainability, safety, security, etc. It equips us with the critical thinking skills to decipher health information, identify harmful environmental factors, and make sustainable choices. For communities, education fosters social cohesion, builds resilience, and drives innovation, ultimately shaping the health and well-being of all residents.
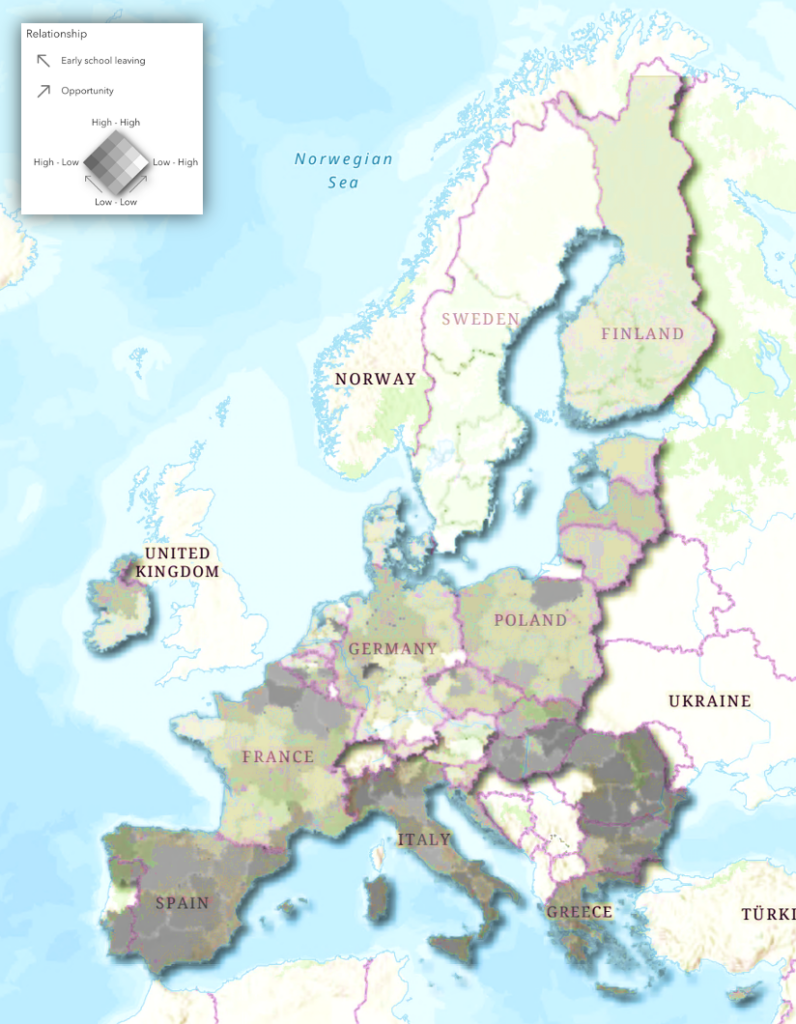
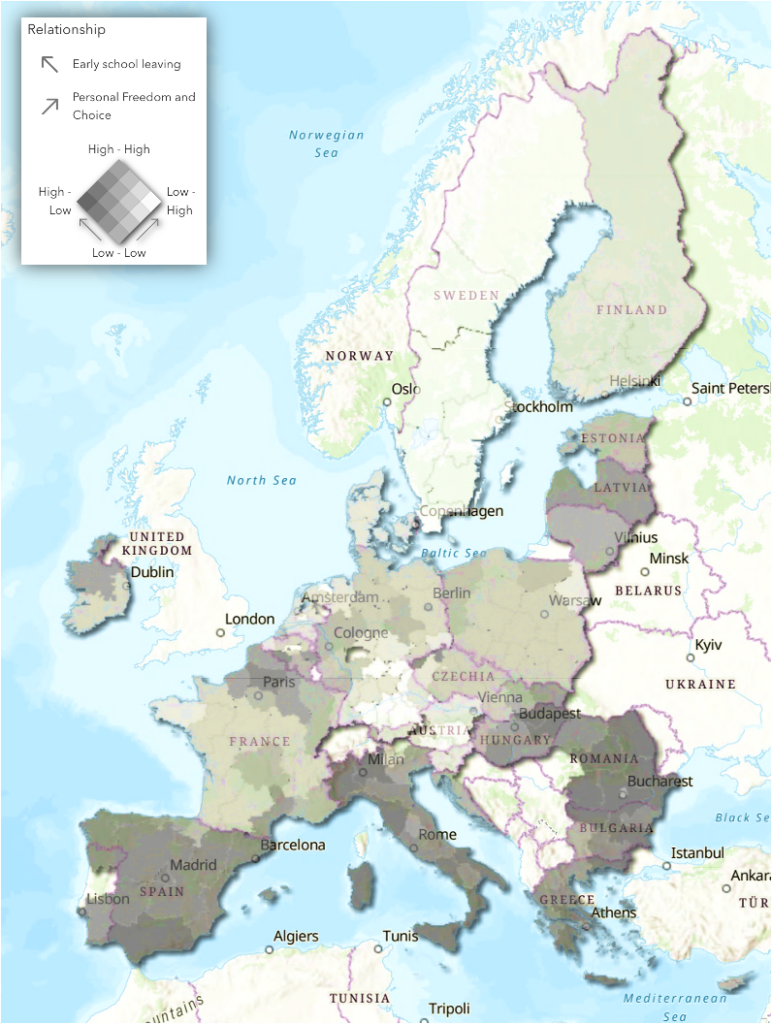
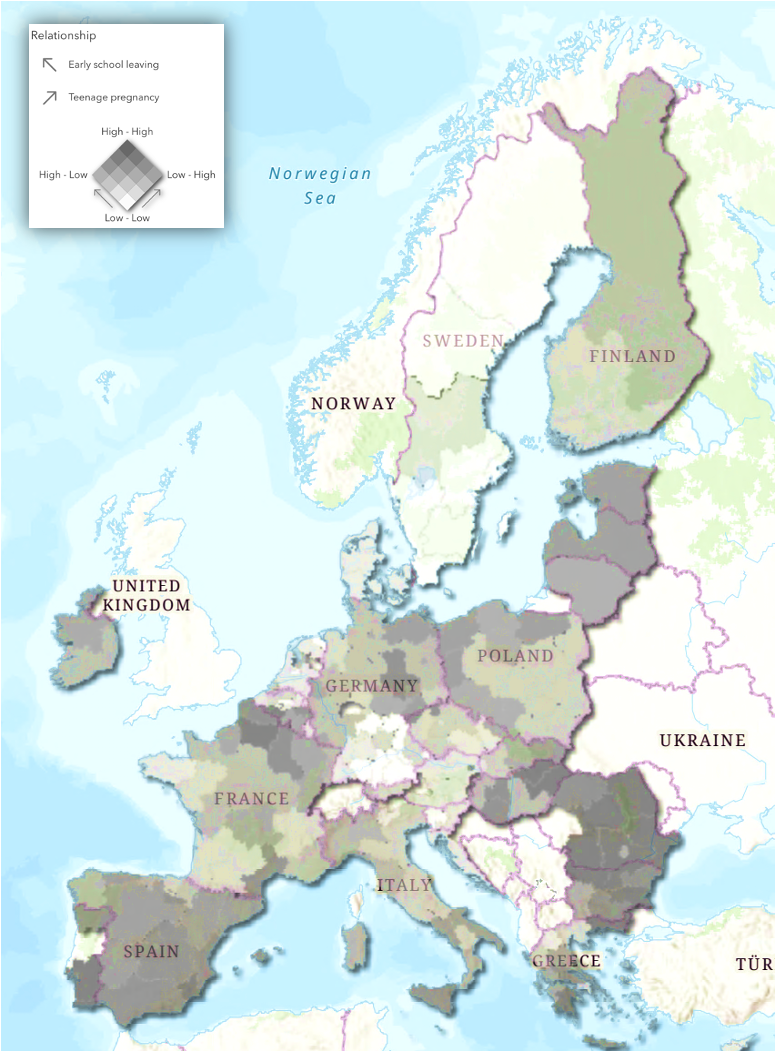
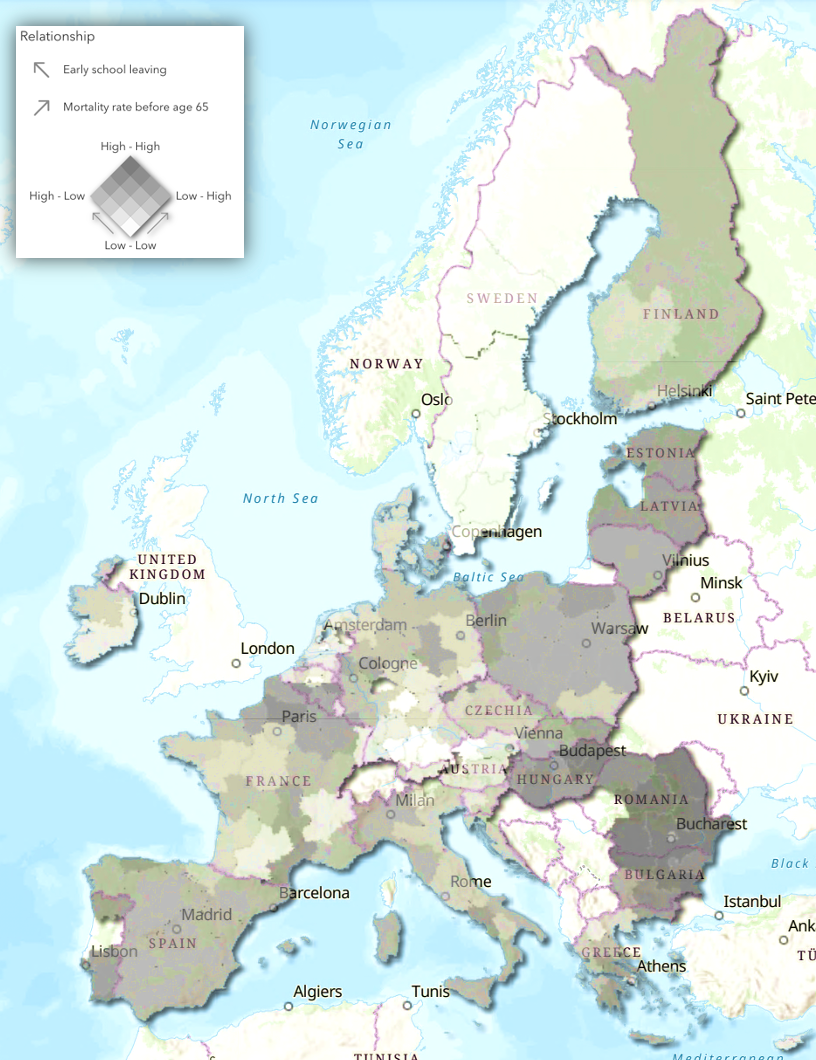
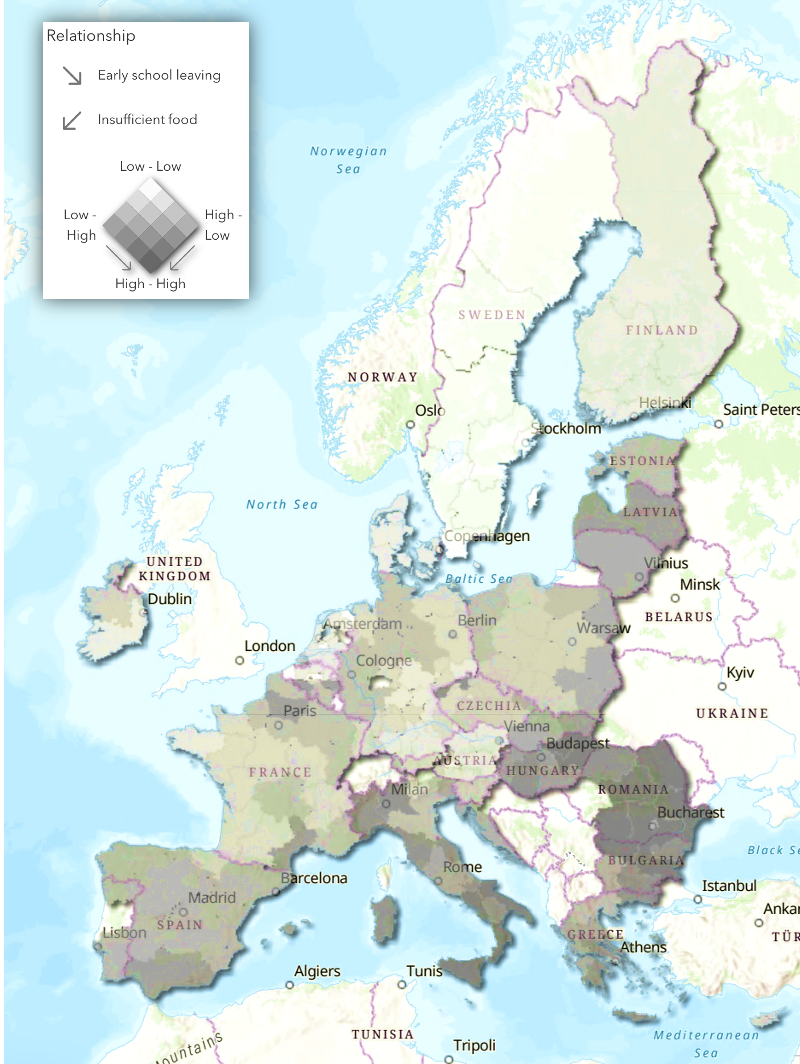
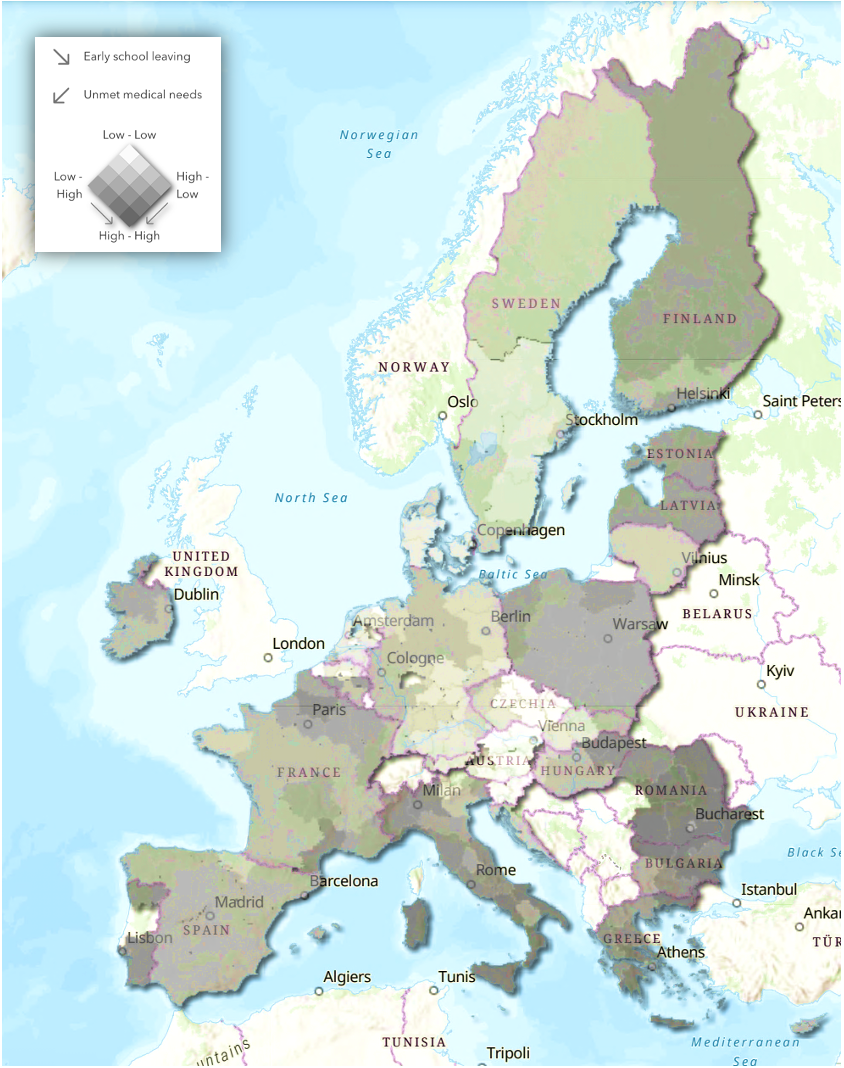
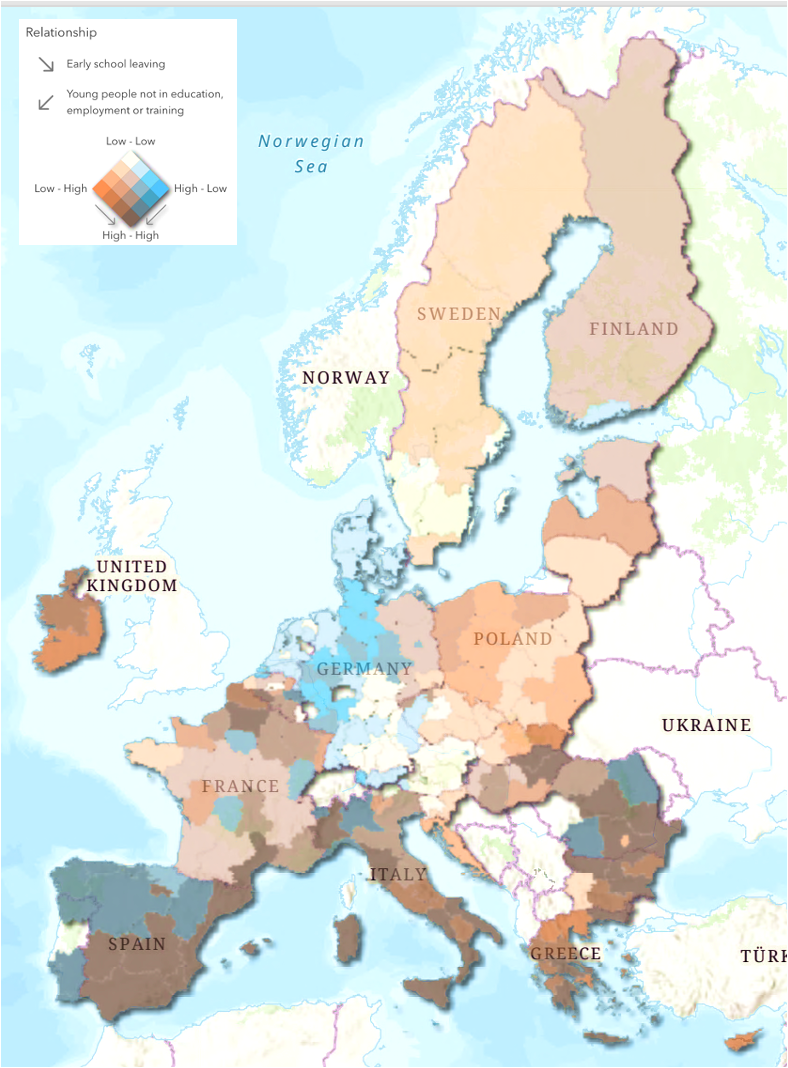
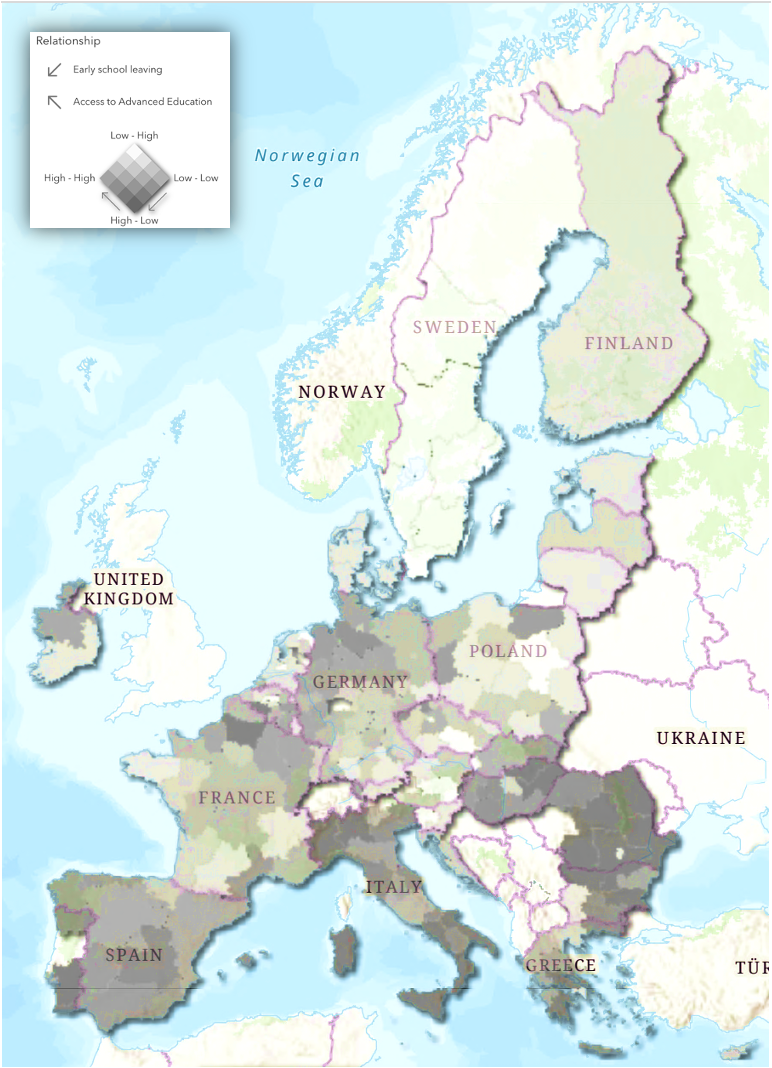
The following maps show the relationship between early school leavers and opportunity and personal freedom and choice, influenced by indicators of freedom over life choices, job opportunities, teenage pregnancy, and gender gap.
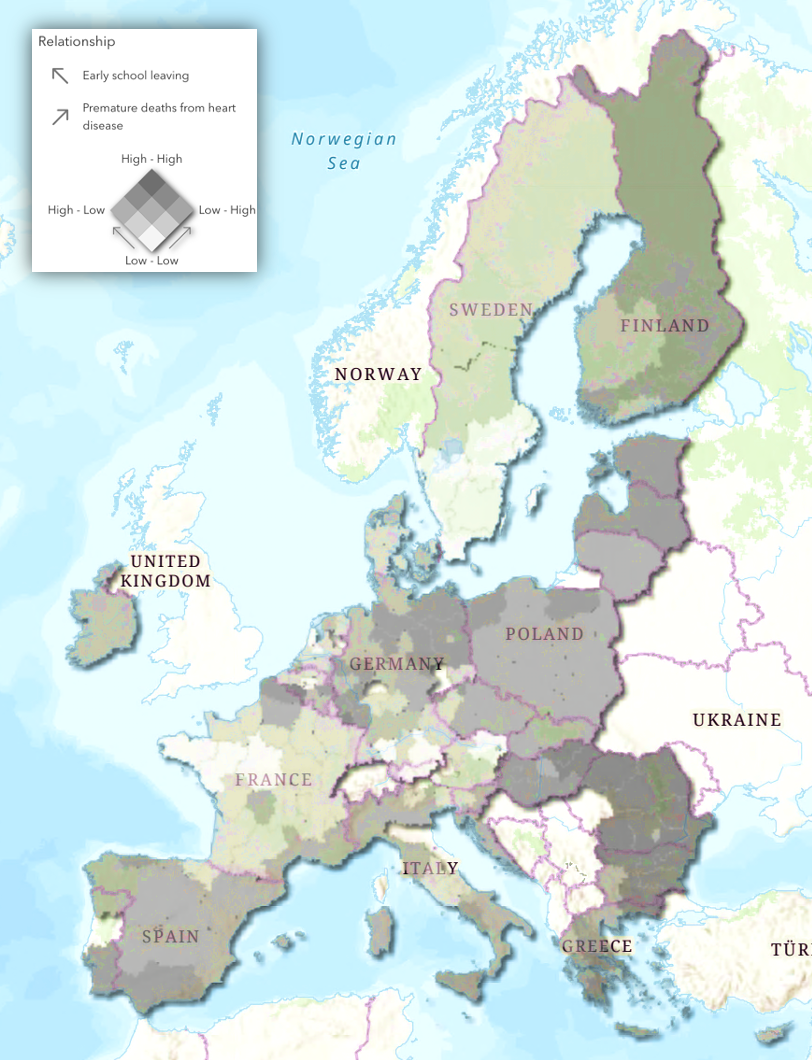
These maps dig into other dimensions of early school leaving presented before, including the social and health dimensions, including access to advanced education and young people, not in education or employment and other health-related measures: unmet medical needs, insufficient food, mortality rate before the age of 65, teenage pregnancy or premature death from health disease.
While many measures show similarities, geographical differences can still be depicted.